Dashboard and Shortcuts
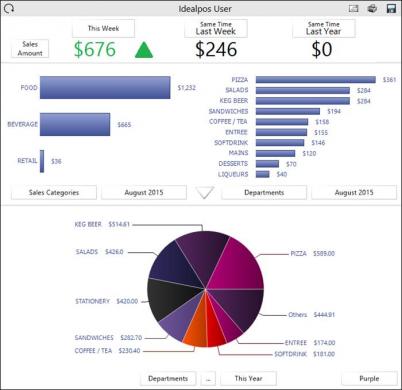
The Idealpos back office screen can show a graphical dashboard, which is updated automatically as the sales information, is received from the POS terminals.
The Dashboard can display graphs based on sales data for Departments, Tenders, Locations, Clerks, POS Terminals and Sites. The graph located the bottom of the Dashboard can show hourly sales, top 10 by quantity and top 10 by amount.
Located on the left hand side of the back office screen, the shortcut bar allows each user to create shortcuts to access the most commonly used parts of the software and their favourite reports.


